You might know Iconosquare from the year roundup videos, but did you know they do so much more than that? You can use Iconosquare to see Instagram pics with specific hashtags on the web (useful if you need to link to them in a blog post!) and group your following list to make it easier to find pictures you love. However one of the most useful sections is probably the statistics section.
After logging in with your Instagram account, head over to the stats page for some interesting information about your account. There are lots of different stats to look at, but the optimisation page is probably the most interesting if you’re looking to build up your Instagram followers.
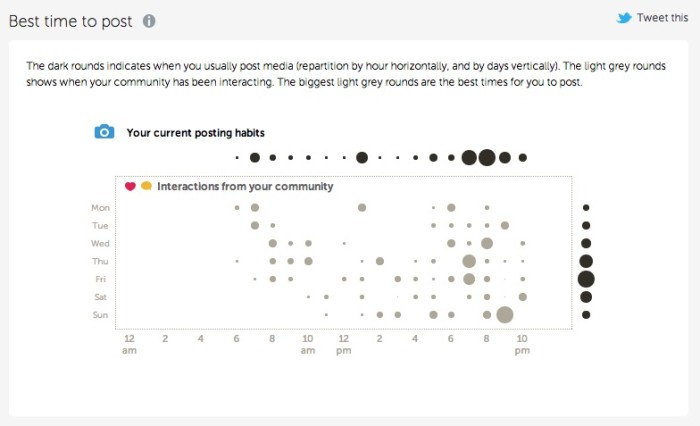
First, you can see the times and days that you’re posting your content, along with when people are interacting most with them. From the below diagram, the best time for this account to post is Sunday at 9pm
You can also see how long your posts will get comments and likes – this graph shows the amount of time between posting and the amount of interaction that goes on.
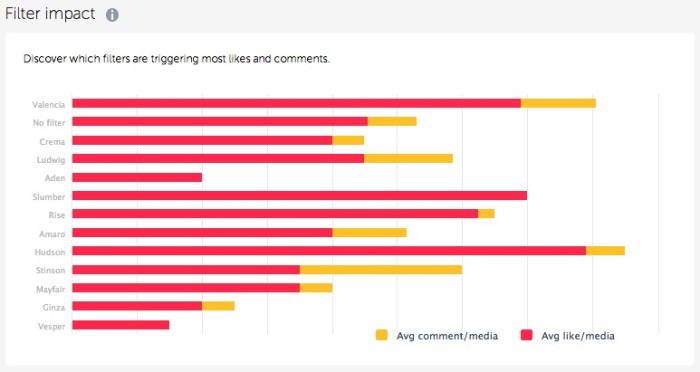
Interestingly, you can also see which filters get the most attention as well
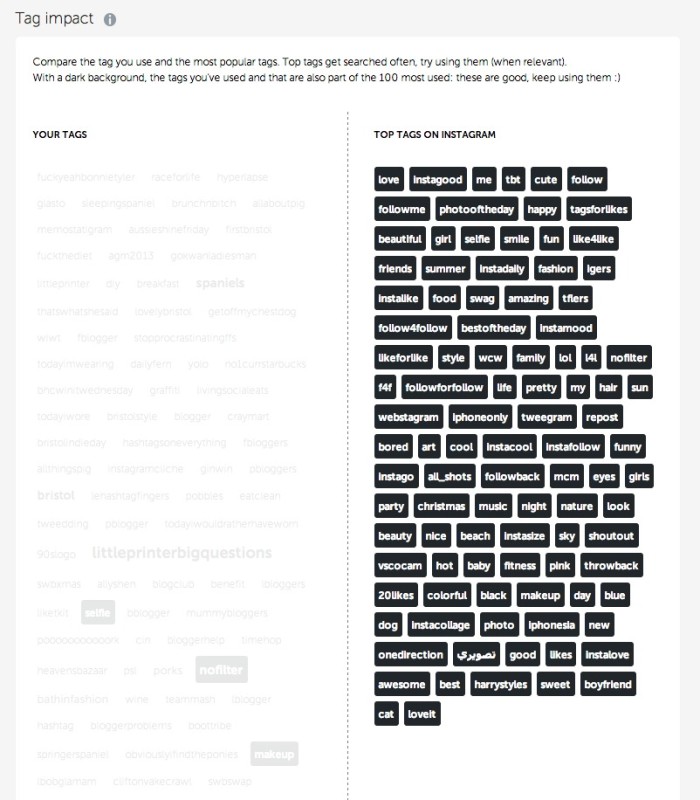
This section shows the tags that you’ve used, and which ones are in the top 100.


